一、基础环境
| 环境/组件 | 版本 | 下载地址 |
|---|---|---|
| 操作系统 | CentOS 7.3 | http://archive.kernel.org/centos-vault/7.3.1611/isos/x86_64/CentOS-7-x86_64-DVD-1611.iso |
| Prometheus | 2.6.0 | https://prometheus.io/download/#prometheus |
| go | 1.11.4 | https://golang.org/dl/ |
| Grafana | 5.4.2 | https://dl.grafana.com/oss/release/grafana-5.4.2-1.x86_64.rpm |
二、安装go
1、解压安装
tar -C /usr/local/ -xvf go1.11.4.linux-amd64.tar.gz2、配置环境变量
vim /etc/profile

export GOROOT=/usr/local/go
export GOBIN=$GOROOT/bin
export GOPATH=$GOROOT/path

export PATH=$PATH:$GOBIN:$GOPATH/bin

source /etc/profile
3、验证
go version
三、安装Prometheus
1、安装
cd

tar -xvf Prometheus-2.6.0.linux-amd64.tar.gz

mv Prometheus-2.6.0.linux-amd64 /usr/local/prometheus-2.6.0

ln -sv /usr/local/prometheus-2.6.0 /usr/local/prometheus
2、启动
- 命令行方式
普罗米修斯默认配置文件
cd /usr/local/prometheus/
vim prometheus.yml
# 检测配置文件语法
./promtool check config prometheus.yml
# 测试启动
/usr/local/prometheus/prometheus --config.file=/usr/local/prometheus/prometheus.yml启动脚本
centos6
vim /etc/init.d/prometheus#!/bin/bash ### BEGIN INIT INFO # Provides: prometheus # Default-Start: 2 3 4 5 # Default-Stop: 0 1 6 # Short-Description: starts prometheus # Description: starts the prometheus Process Manager daemon ### END INIT INFO prefix=/usr/local/prometheus exec_prefix=${prefix} prometheus_BIN=${exec_prefix}/prometheus prometheus_LOG=${exec_prefix}/prometheus.log prometheus_PID=${exec_prefix}/pid prometheus_CONF=${exec_prefix}/prometheus.yml prometheus_DB="/data1/prometheus_data" prometheus_PORT=51724 case "$1" in start) if [[ -f $prometheus_PID ]] then if [[ ! -z `cat $prometheus_PID` ]] then echo -n "prometheus is running" exit 0 fi fi echo -e "Starting prometheus \n" # --storage.tsdb.retention=365d 可选清理时间 /usr/bin/nohup $prometheus_BIN --config.file="${prometheus_CONF}" --web.listen-address="0.0.0.0:${prometheus_PORT}" --storage.tsdb.path="${prometheus_DB}" --web.enable-lifecycle > $prometheus_LOG 2>&1 & echo $! > $prometheus_PID ;; stop) if [[ ! -z `cat $prometheus_PID` ]] then echo -e "Stop prometheus \n" cat $prometheus_PID | xargs kill -9 else echo -n "prometheus not running" fi echo > $prometheus_PID ;; reload) if [[ -f $prometheus_PID ]] then kill -1 `cat $prometheus_PID` fi ;; status) if [[ -z `cat $prometheus_PID` ]] then echo "prometheus is stopped" else echo "prometheus is running" fi ;; restart) $0 stop $0 start ;; *) echo "Usage: $0 {start|stop|reload|status|restart}" exit 1 ;; esac- 赋予权限
chmod 755 /etc/init.d/prometheus
- 赋予权限
centos7
vim /etc/systemd/system/prometheus.service[Unit] Description=Prometheus Server After=network.target [Service] WorkingDirectory=/usr/local/prometheus/ ExecStart=/usr/local/prometheus/prometheus --config.file=/usr/local/prometheus/prometheus.yml --web.listen-address=:9090 --web.enable-lifecycle User=root [Install] WantedBy=multi-user.target- 赋予权限
chmod 755 /etc/systemd/system/prometheus.service

systemctl daemon-reload

service promethues start
3、验证
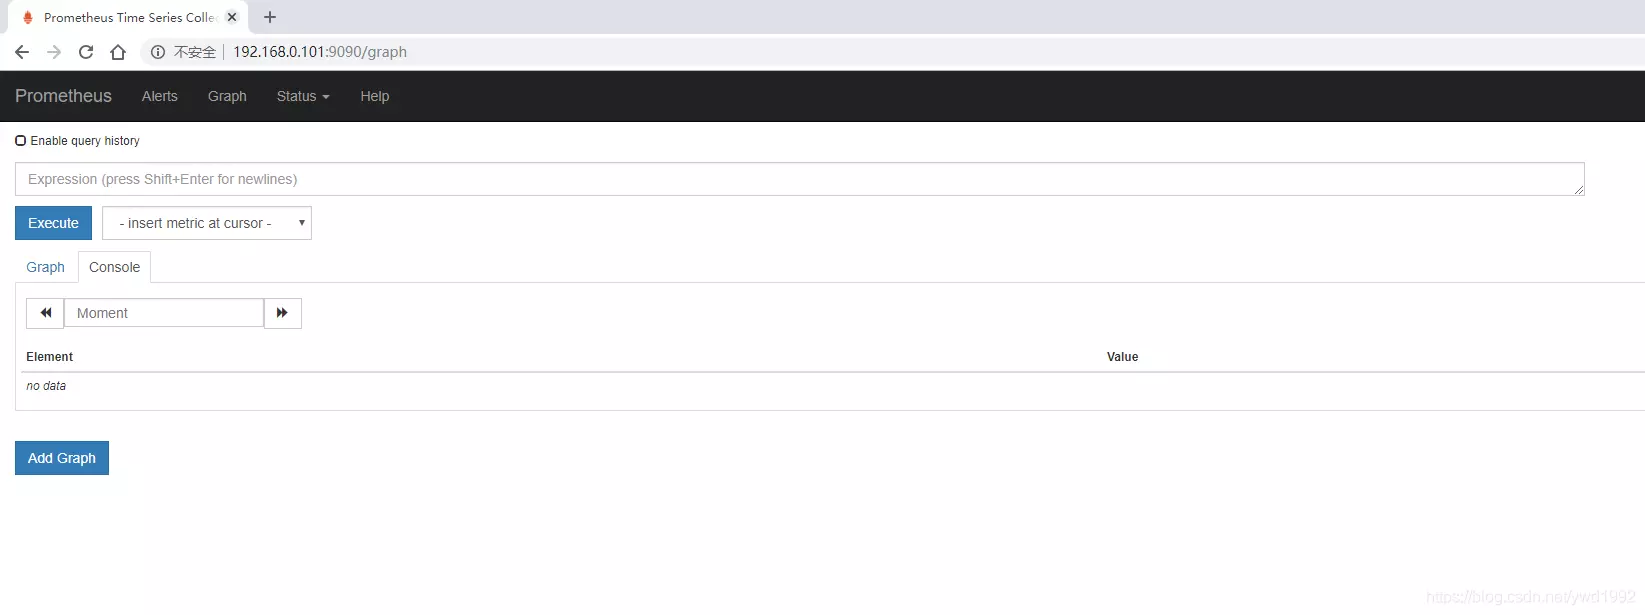
浏览器打开IP:9090端口即可打开普罗米修斯自带的监控页面
四、安装Grafana
普罗米修斯默认的页面可能没有那么直观,我们可以安装grafana使监控看起来更直观
1、安装
rpm -ivh --nodeps grafana-5.4.2-1.x86_64.rpm2、启动
安装插件
grafana-cli plugins install grafana-piechart-panel 1.3.8启动
/bin/systemctl daemon-reload
/bin/systemctl enable grafana-server.service
/bin/systemctl start grafana-server.service
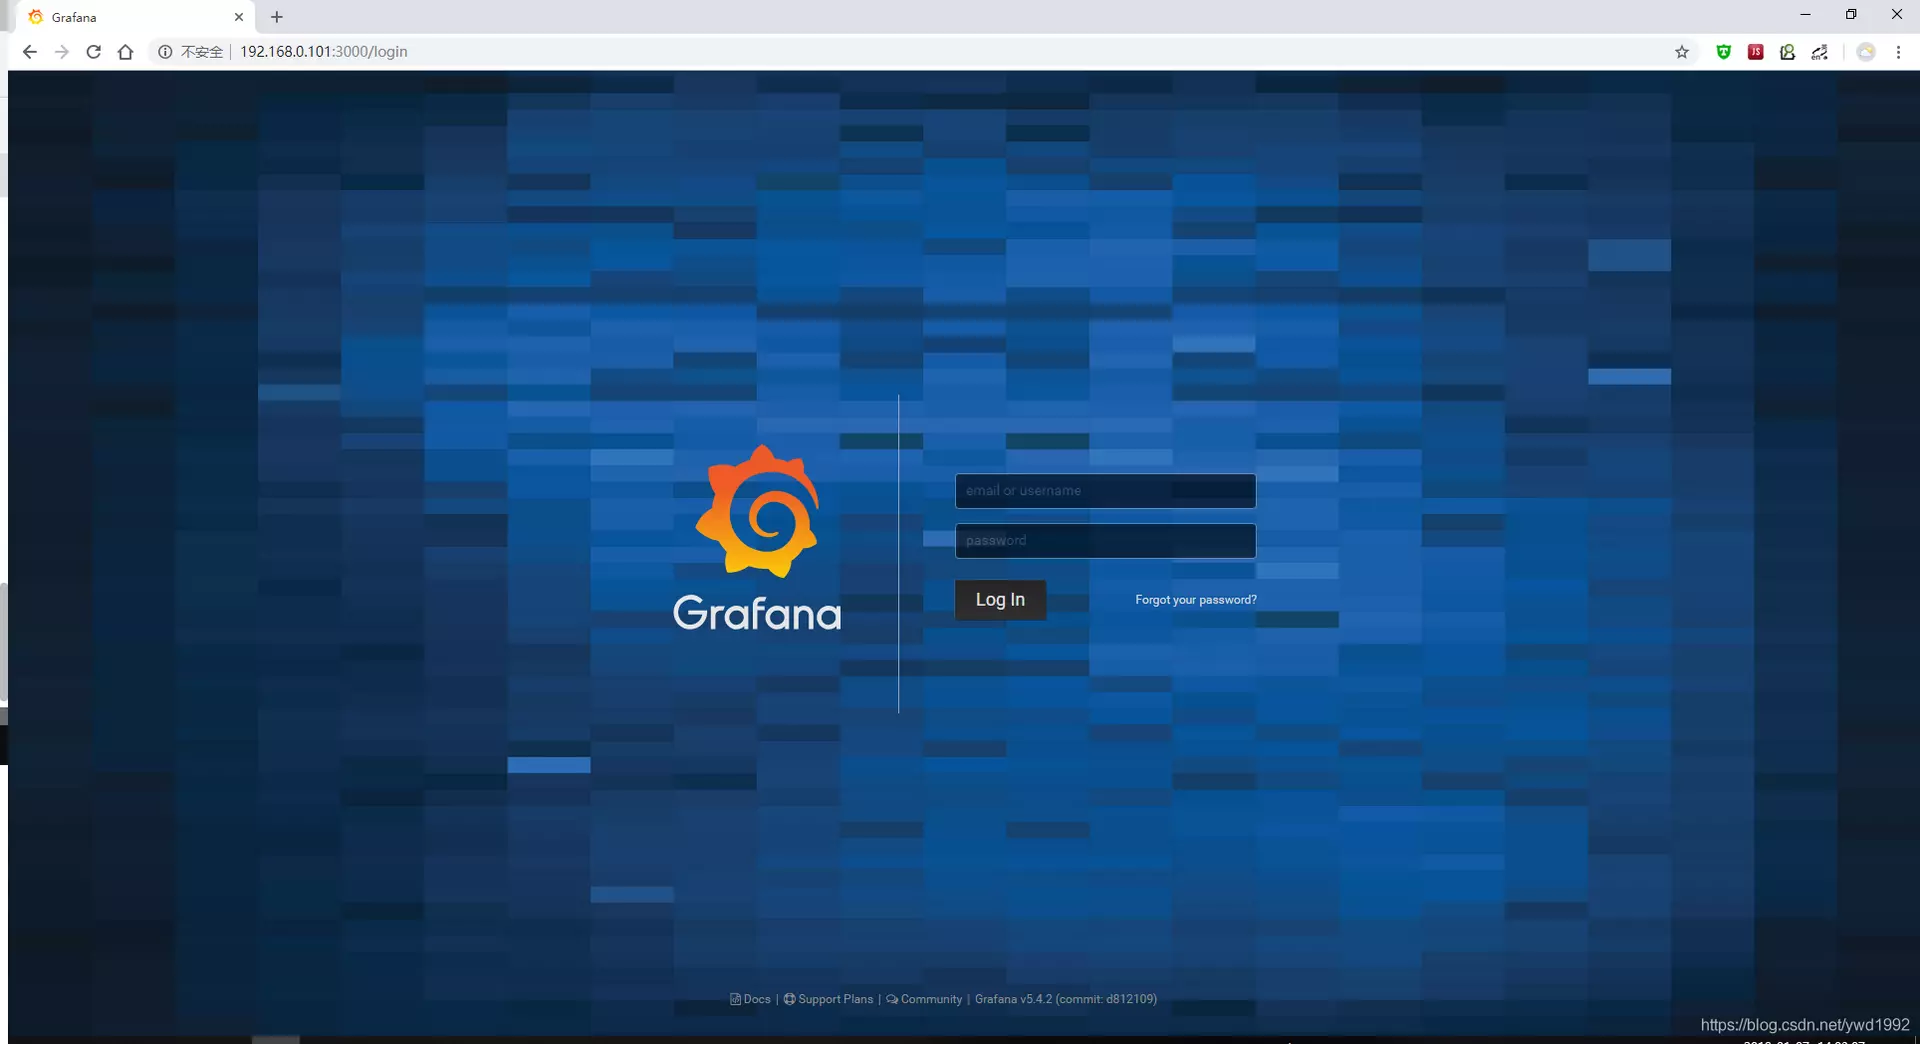
3、访问grafana
浏览器访问IP:3000端口,即可打开grafana页面,默认用户名密码都是admin,初次登录会要求修改默认的登录密码
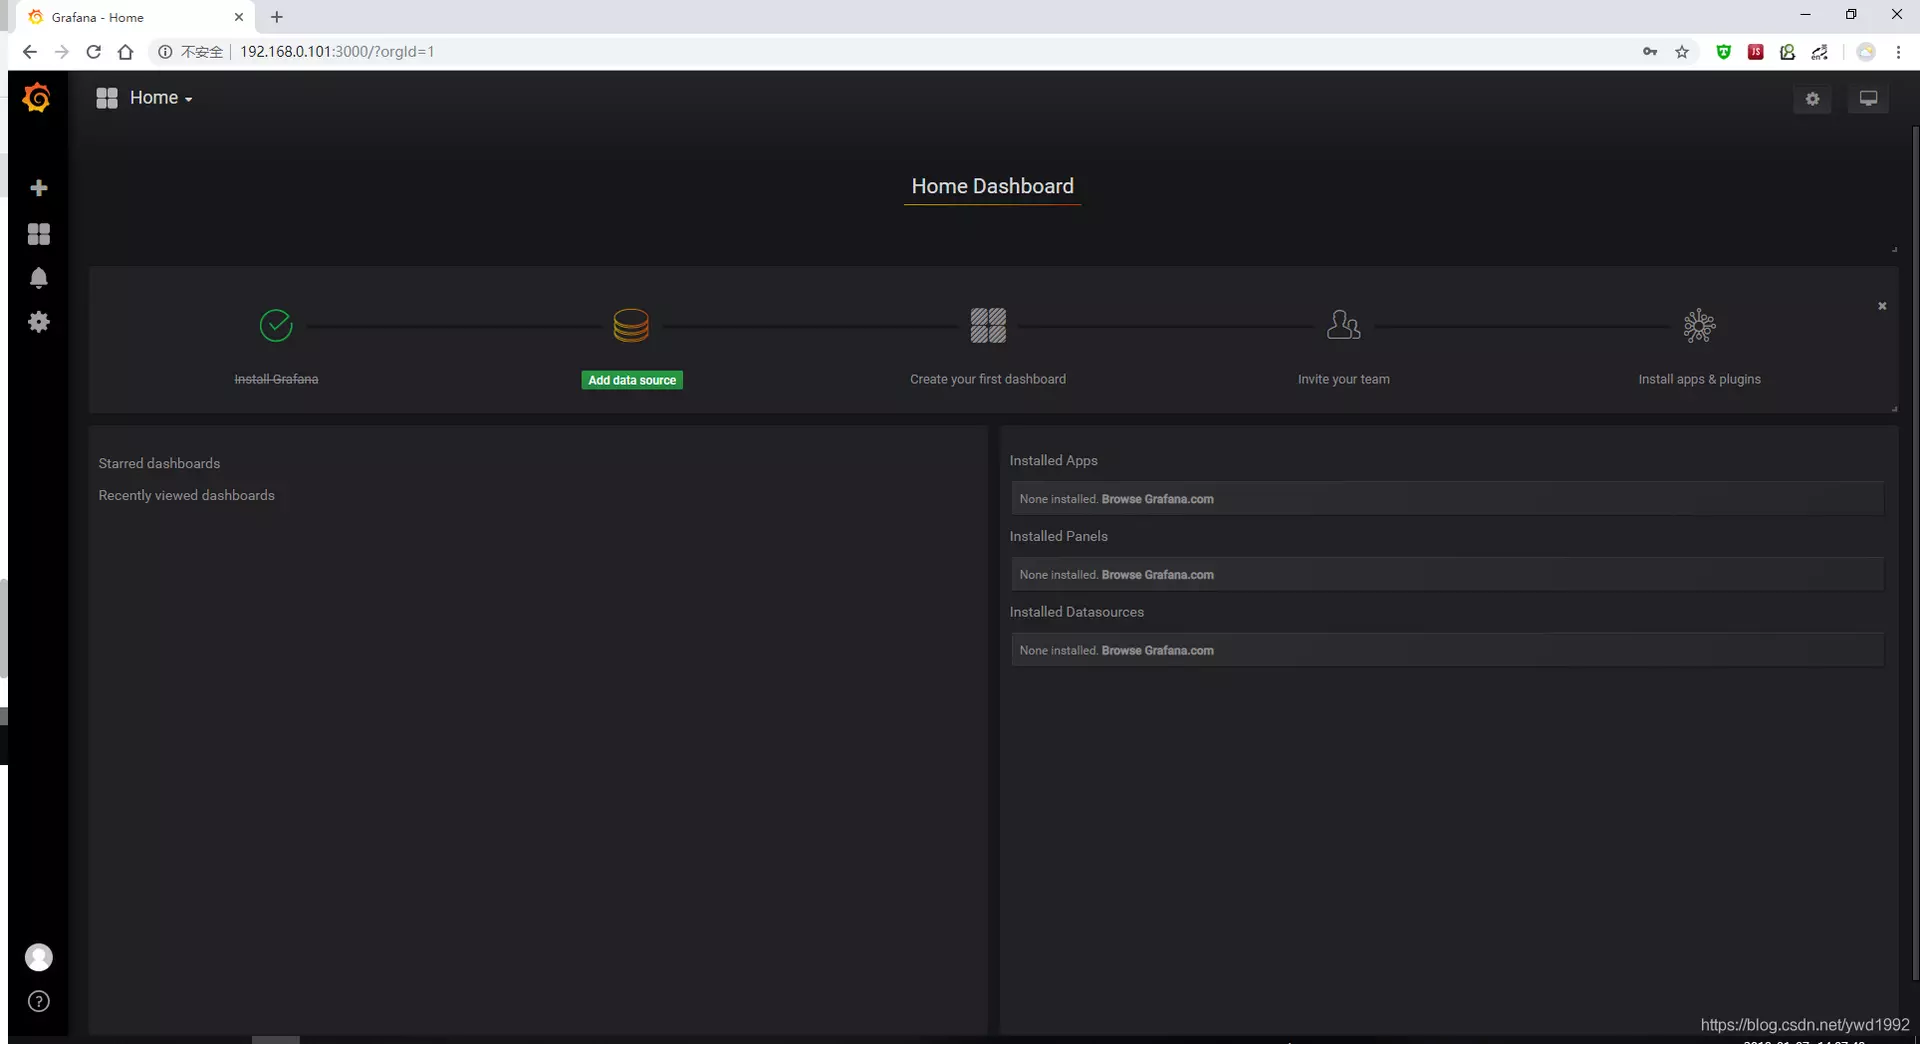
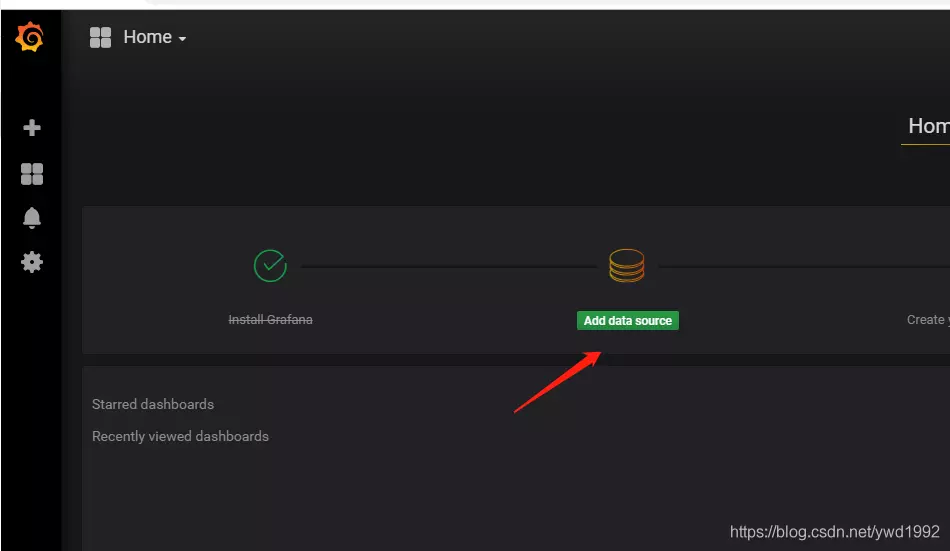
4、添加prometheus数据源
(1)点击主界面的“Add data source”
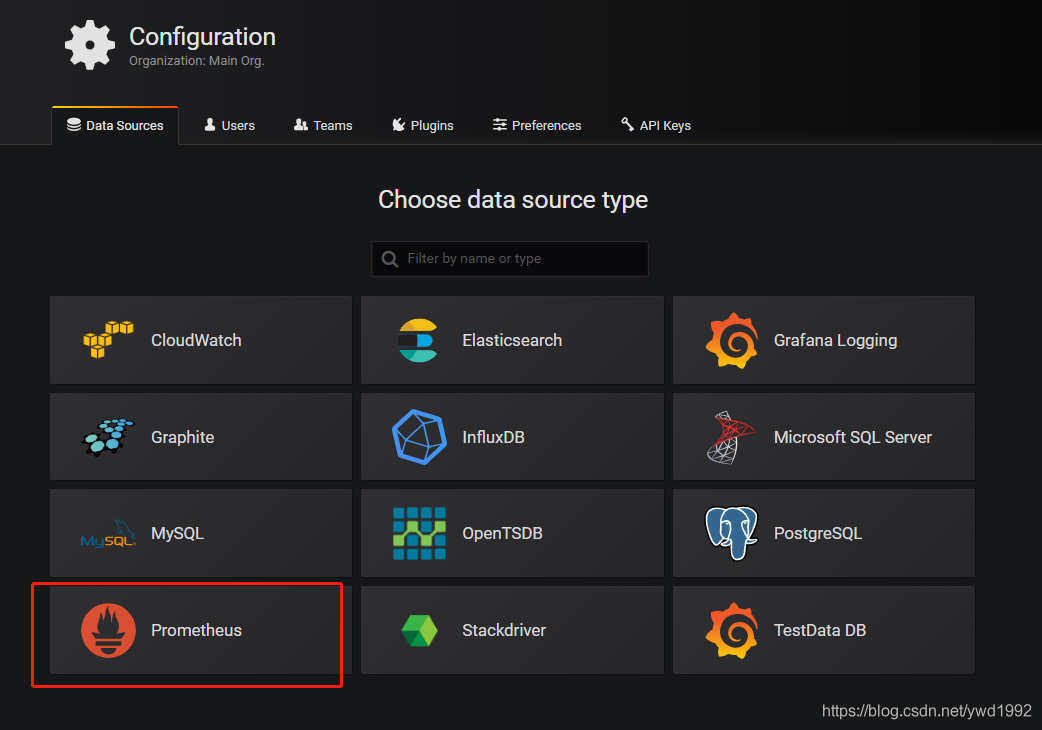
(2)选择Prometheus
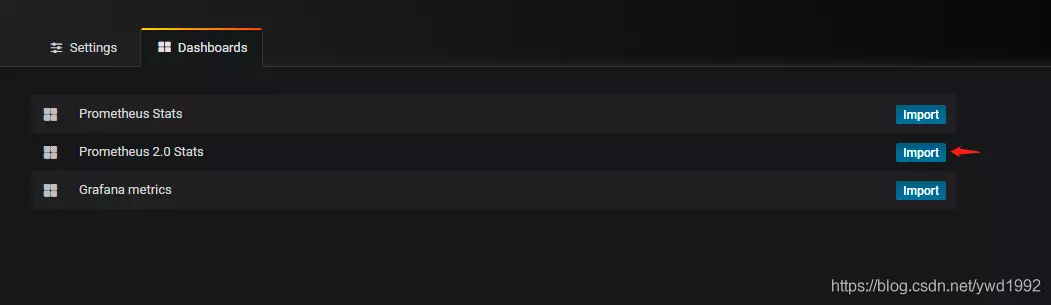
(3)Dashboards页面选择”Prometheus 2.0 Stats”
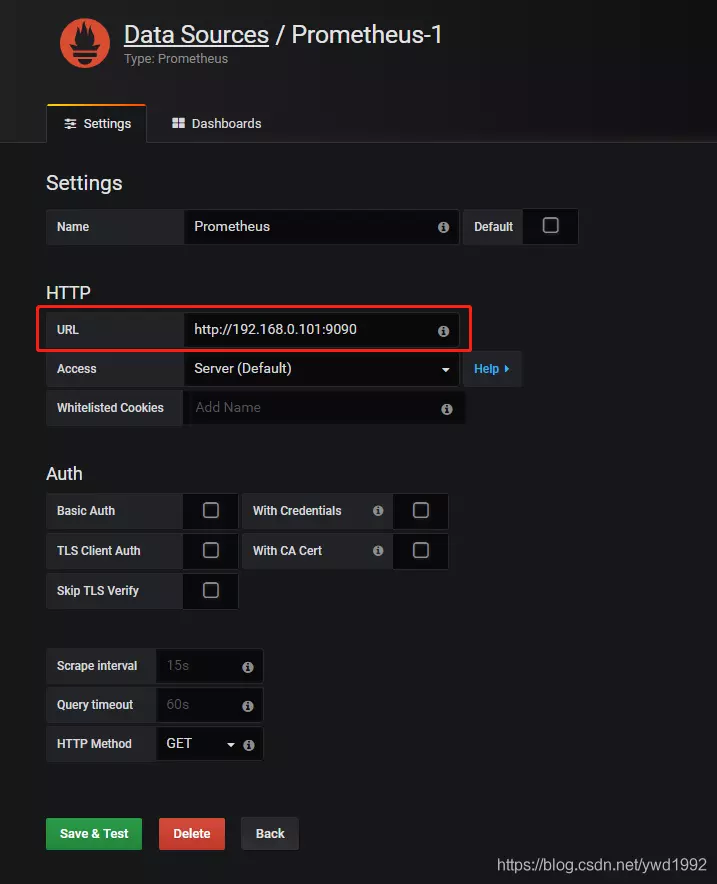
(4)Settings页面填写普罗米修斯地址并保存
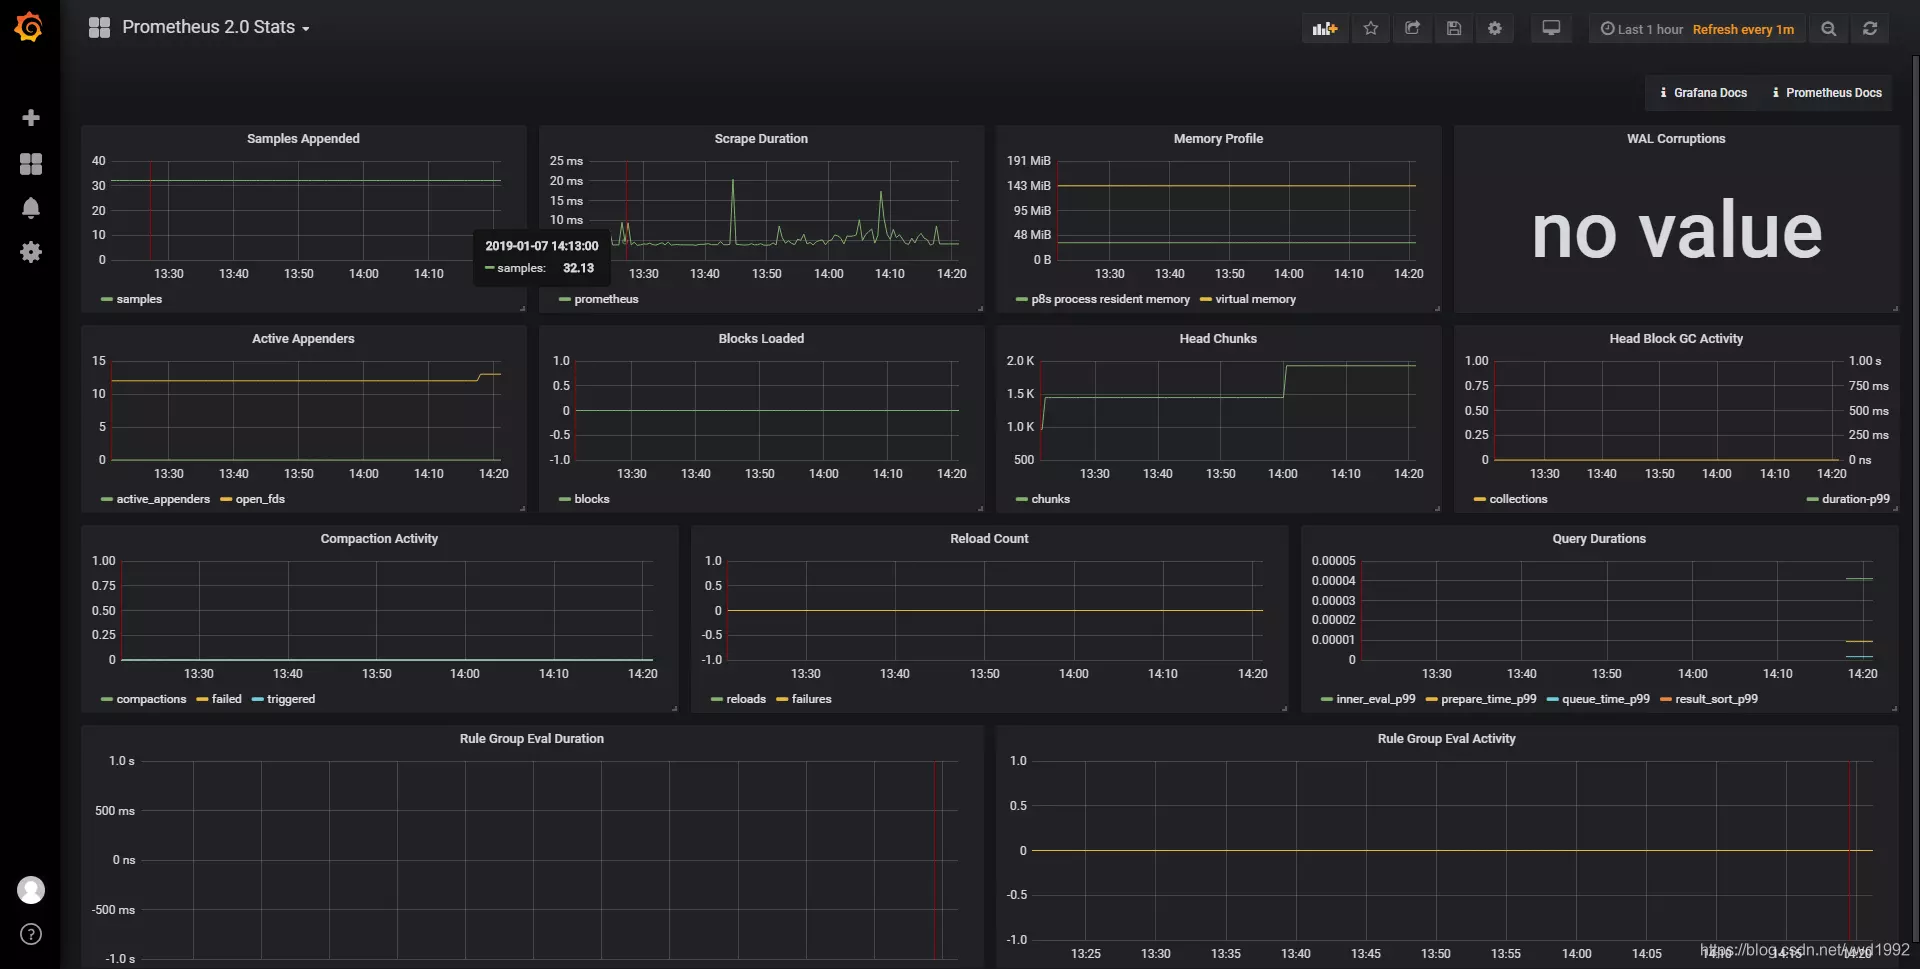
(5)切换到我们刚才添加的”Prometheus 2.0 Stats”即可看到整个监控页面
五、一些常用监控举例
1、监控linux机器(node-exporter)
下载
wget https://github.com/prometheus/node_exporter/releases/download/v1.0.1/node_exporter-1.0.1.linux-amd64.tar.gz

tar zxvf node_exporter-1.0.1.linux-amd64.tar.gz

mv node_exporter-1.0.1.linux-amd64 /usr/local/node_exporter-1.0.1

ln -s /usr/local/node_exporter-1.0.1 /usr/local/node_exporter

chown -R root.root /usr/local/node_exporter-1.0.1
启动脚本
vim /etc/systemd/system/node-exporter.service[Unit] Description=Prometheus Node Exporter After=network.target [Service] WorkingDirectory=/usr/local/node_exporter/ ExecStart=/usr/local/node_exporter/node_exporter --web.listen-address=:12123 User=root [Install] WantedBy=multi-user.target启动方式
systemctl daemon-reload

service node-exporter start

chkconfig node-exporter on
访问验证
http://192.168.12.34:12123/metrics普罗米修斯配置文件添加监控项
vim /usr/local/Prometheus/prometheus.yml
# 默认node-exporter端口为9100

  - job_name: 'node_exporter'
    static_configs:
    - targets: ['127.0.0.1:12123']
      labels:
        instance: Prometheus
重启或reload Prometheus 即可。
- 参考链接
- grafana dashboard:https://grafana.com/dashboards
- grafana plugins:https://grafana.com/plugins
- https://blog.csdn.net/ywd1992/article/details/85989259